
Do you know how to view a project’s activity, traffic and contributions?
Last updated by TiagoAraujo about 4 years ago.See historyWhen you have a public project in GitHub you have some graphs available that give you some statistics helping you to understand who is using your project and why they are using it. These graphs can be found under the Insights tab.

Read more about the project’s graphs: https://help.github.com/en/github/visualizing-repository-data-with-graphs/about-repository-graphs
Some project graphs available:
Pulse Graph
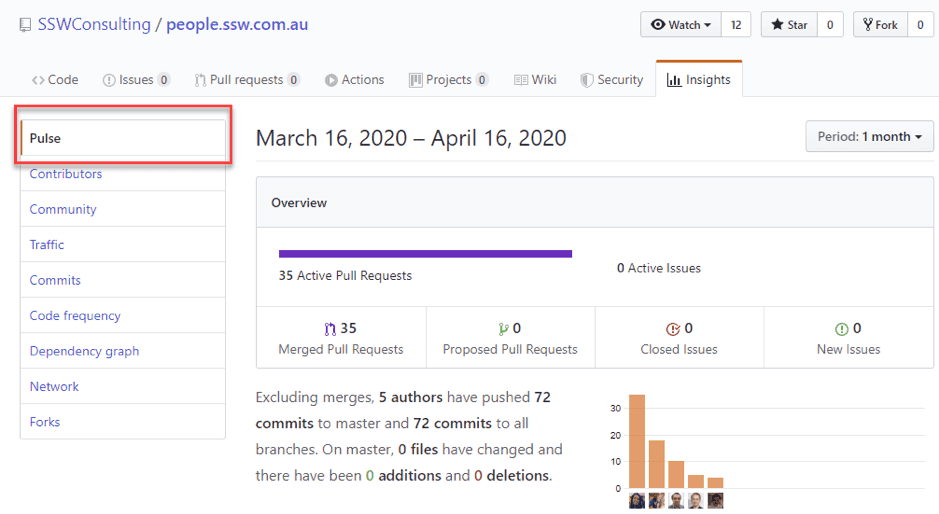
Read more about Pulse Graph : https://help.github.com/en/github/visualizing-repository-data-with-graphs/viewing-a-summary-of-repository-activity
Contributors Graph
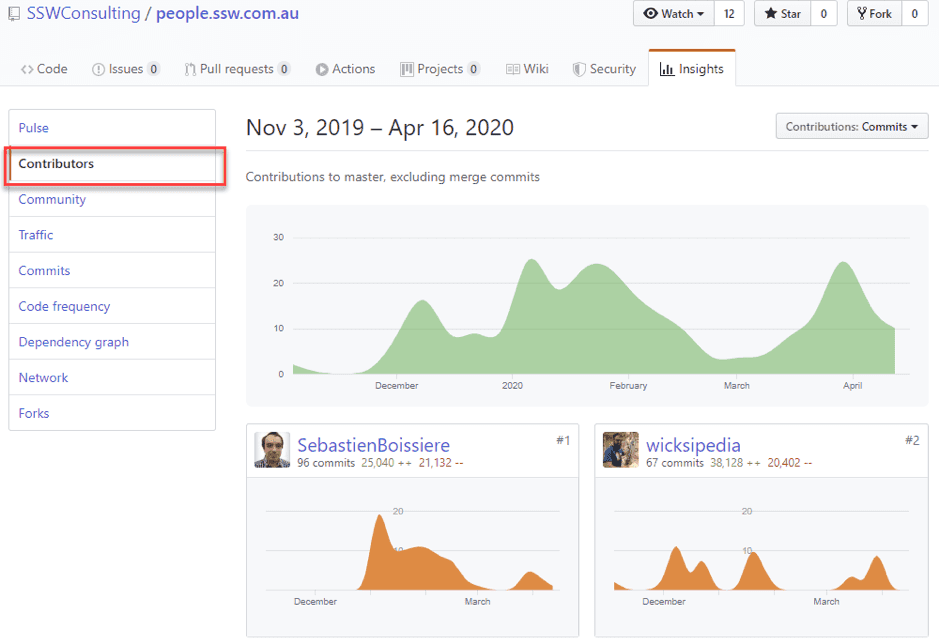
Read more about Contributors Graph : https://help.github.com/en/github/visualizing-repository-data-with-graphs/viewing-a-projects-contributors
Traffic Graph
Read more about Traffic Graph : https://help.github.com/en/github/visualizing-repository-data-with-graphs/viewing-traffic-to-a-repository
