Do you know how to use Google Analytics "Content by Title" reports to track Trends?
Last updated by Tom Bui [SSW] 5 months ago.See historyKeeping on top of your website analytics can be daunting given the vast number of reports that are available in Google Analytics.
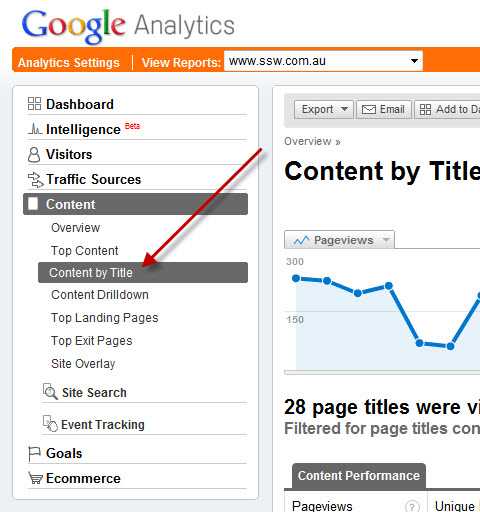
1. Content by Title
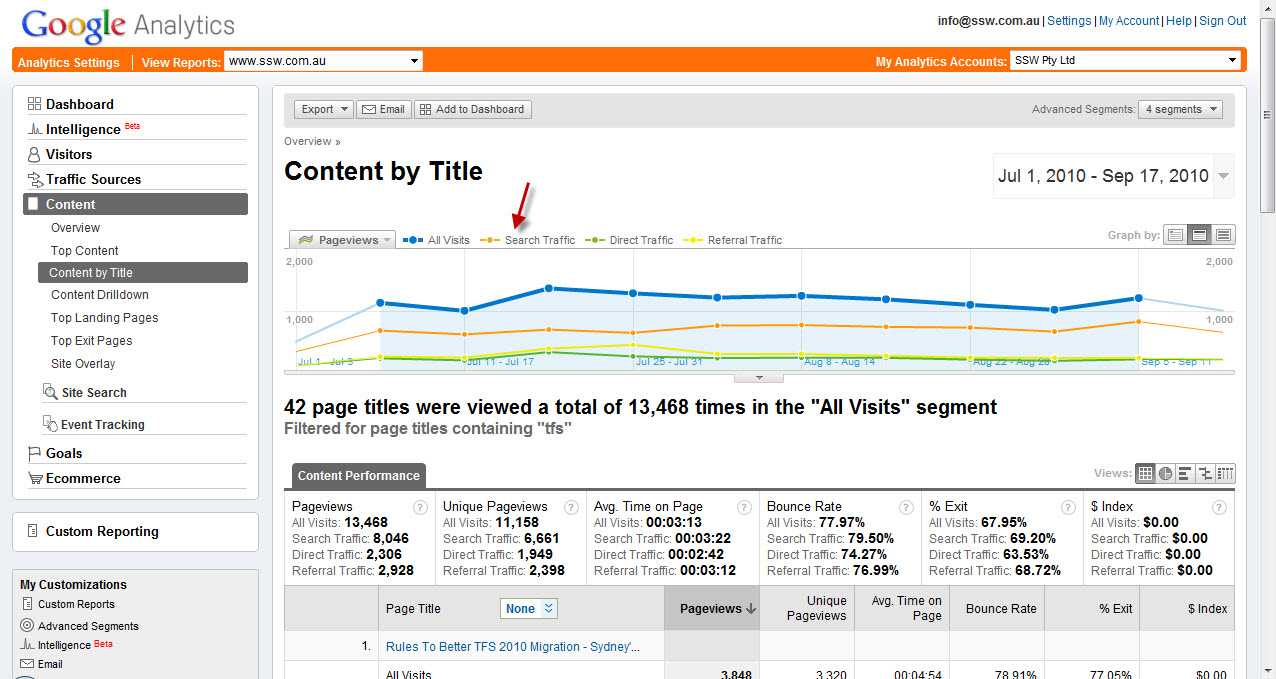
Using the Content by Title report is an excellent way to view the improvement in pages that have been created for specific keyword terms.
2. Setting Date Ranges
Choose the date range you want to view (eg 12 months)
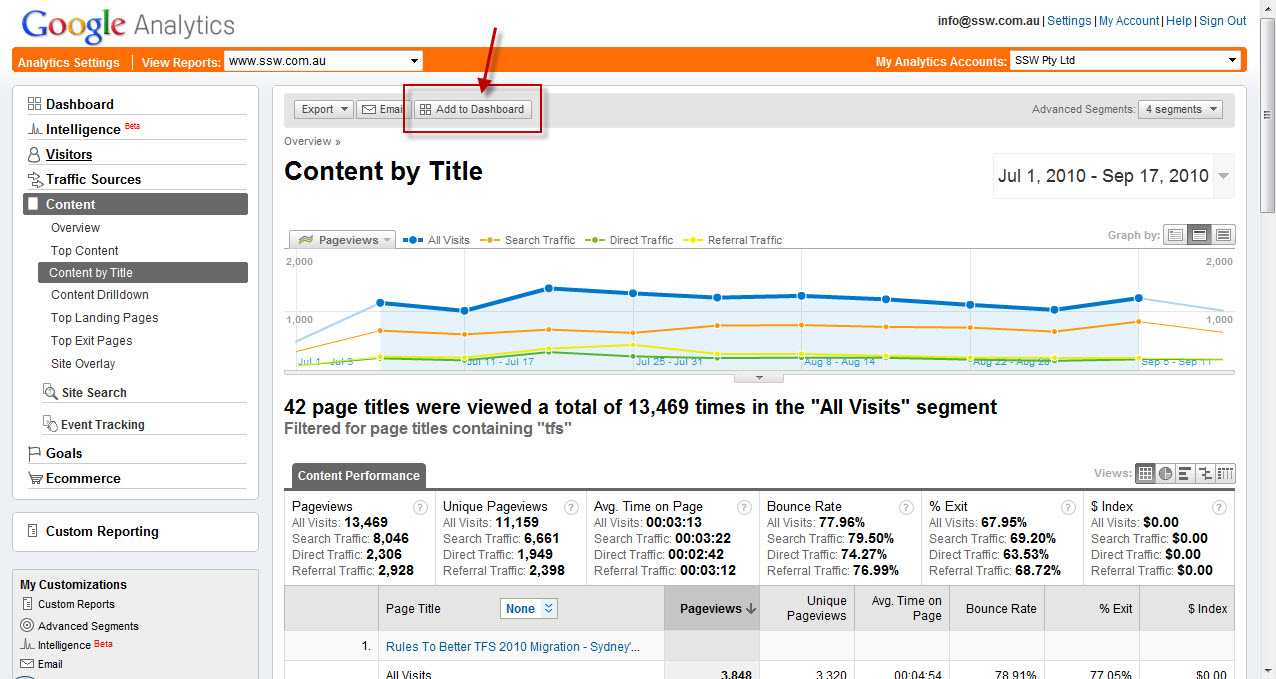
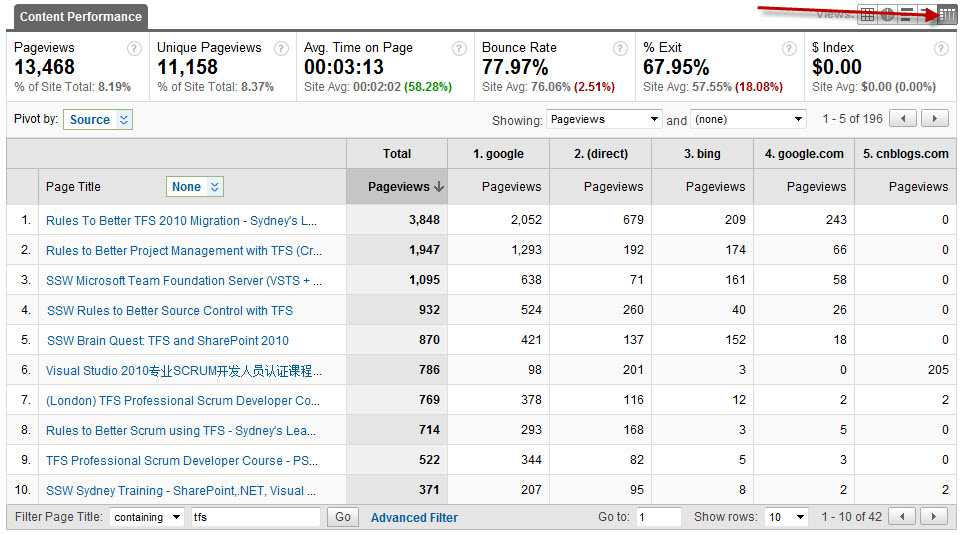
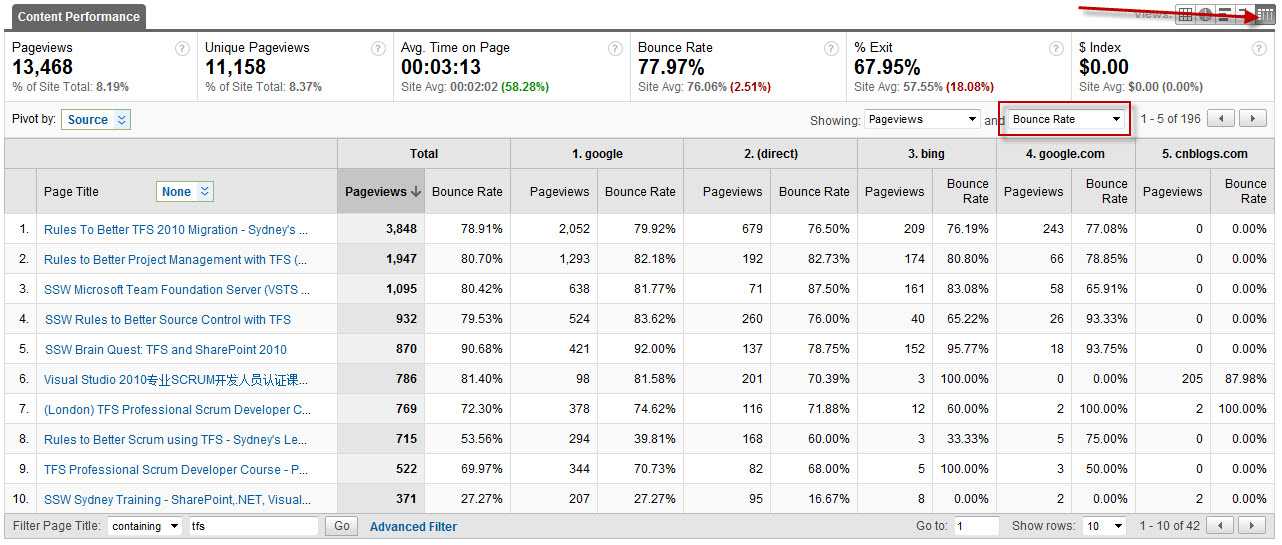
3. Filter By Key Term
Filter the report by the keyword term you are interested in viewing (eg TFS or SQL Server or SharePoint, etc). This assumes that you have used these keyword terms in the titles of the pages (see Rules To Better Google Rankings for more details on best practices for increasing your Google presence).
The overall trend of your pageviews should be increasing.
4. View by Day, Week and Month Trends
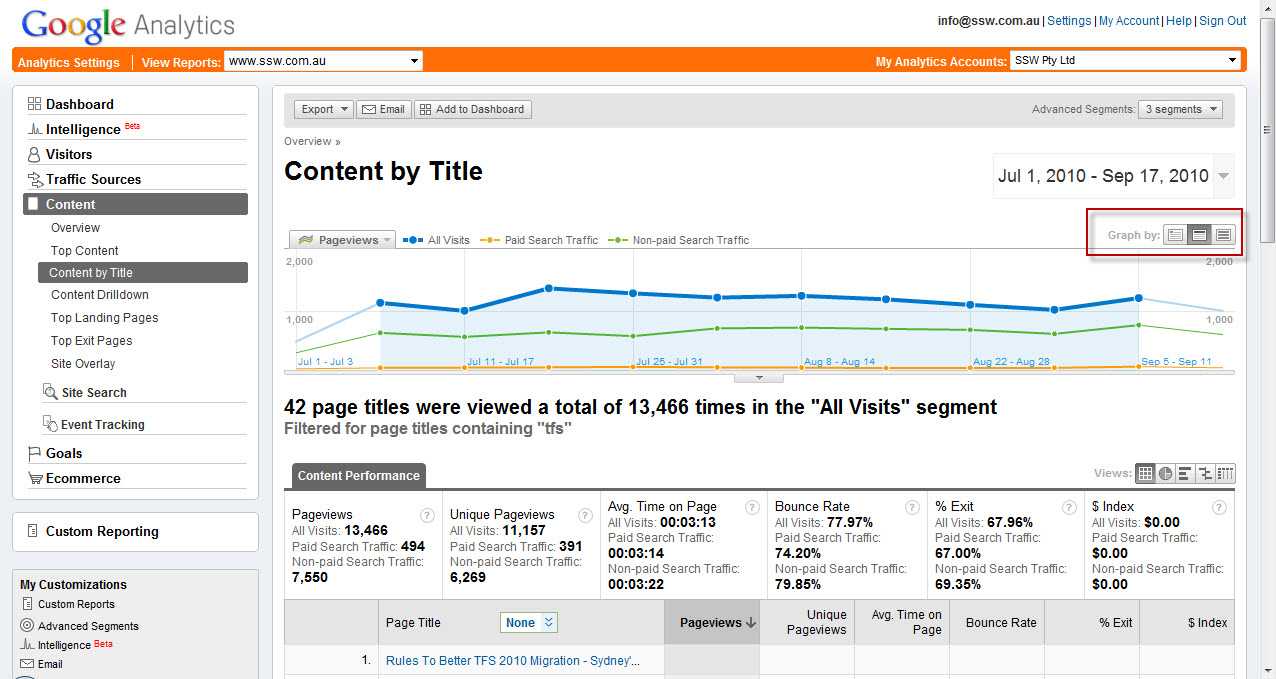
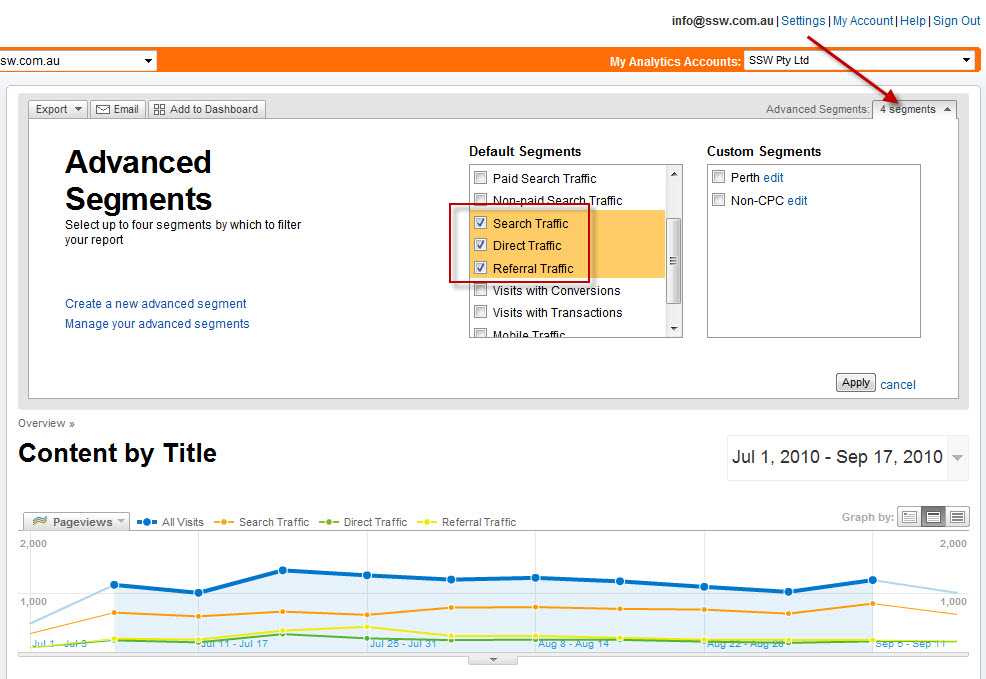
5. View Segments
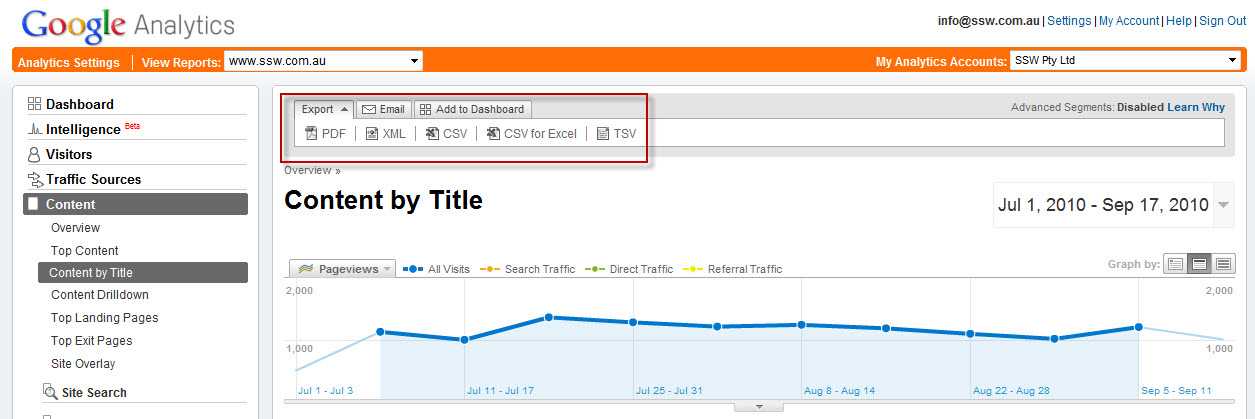
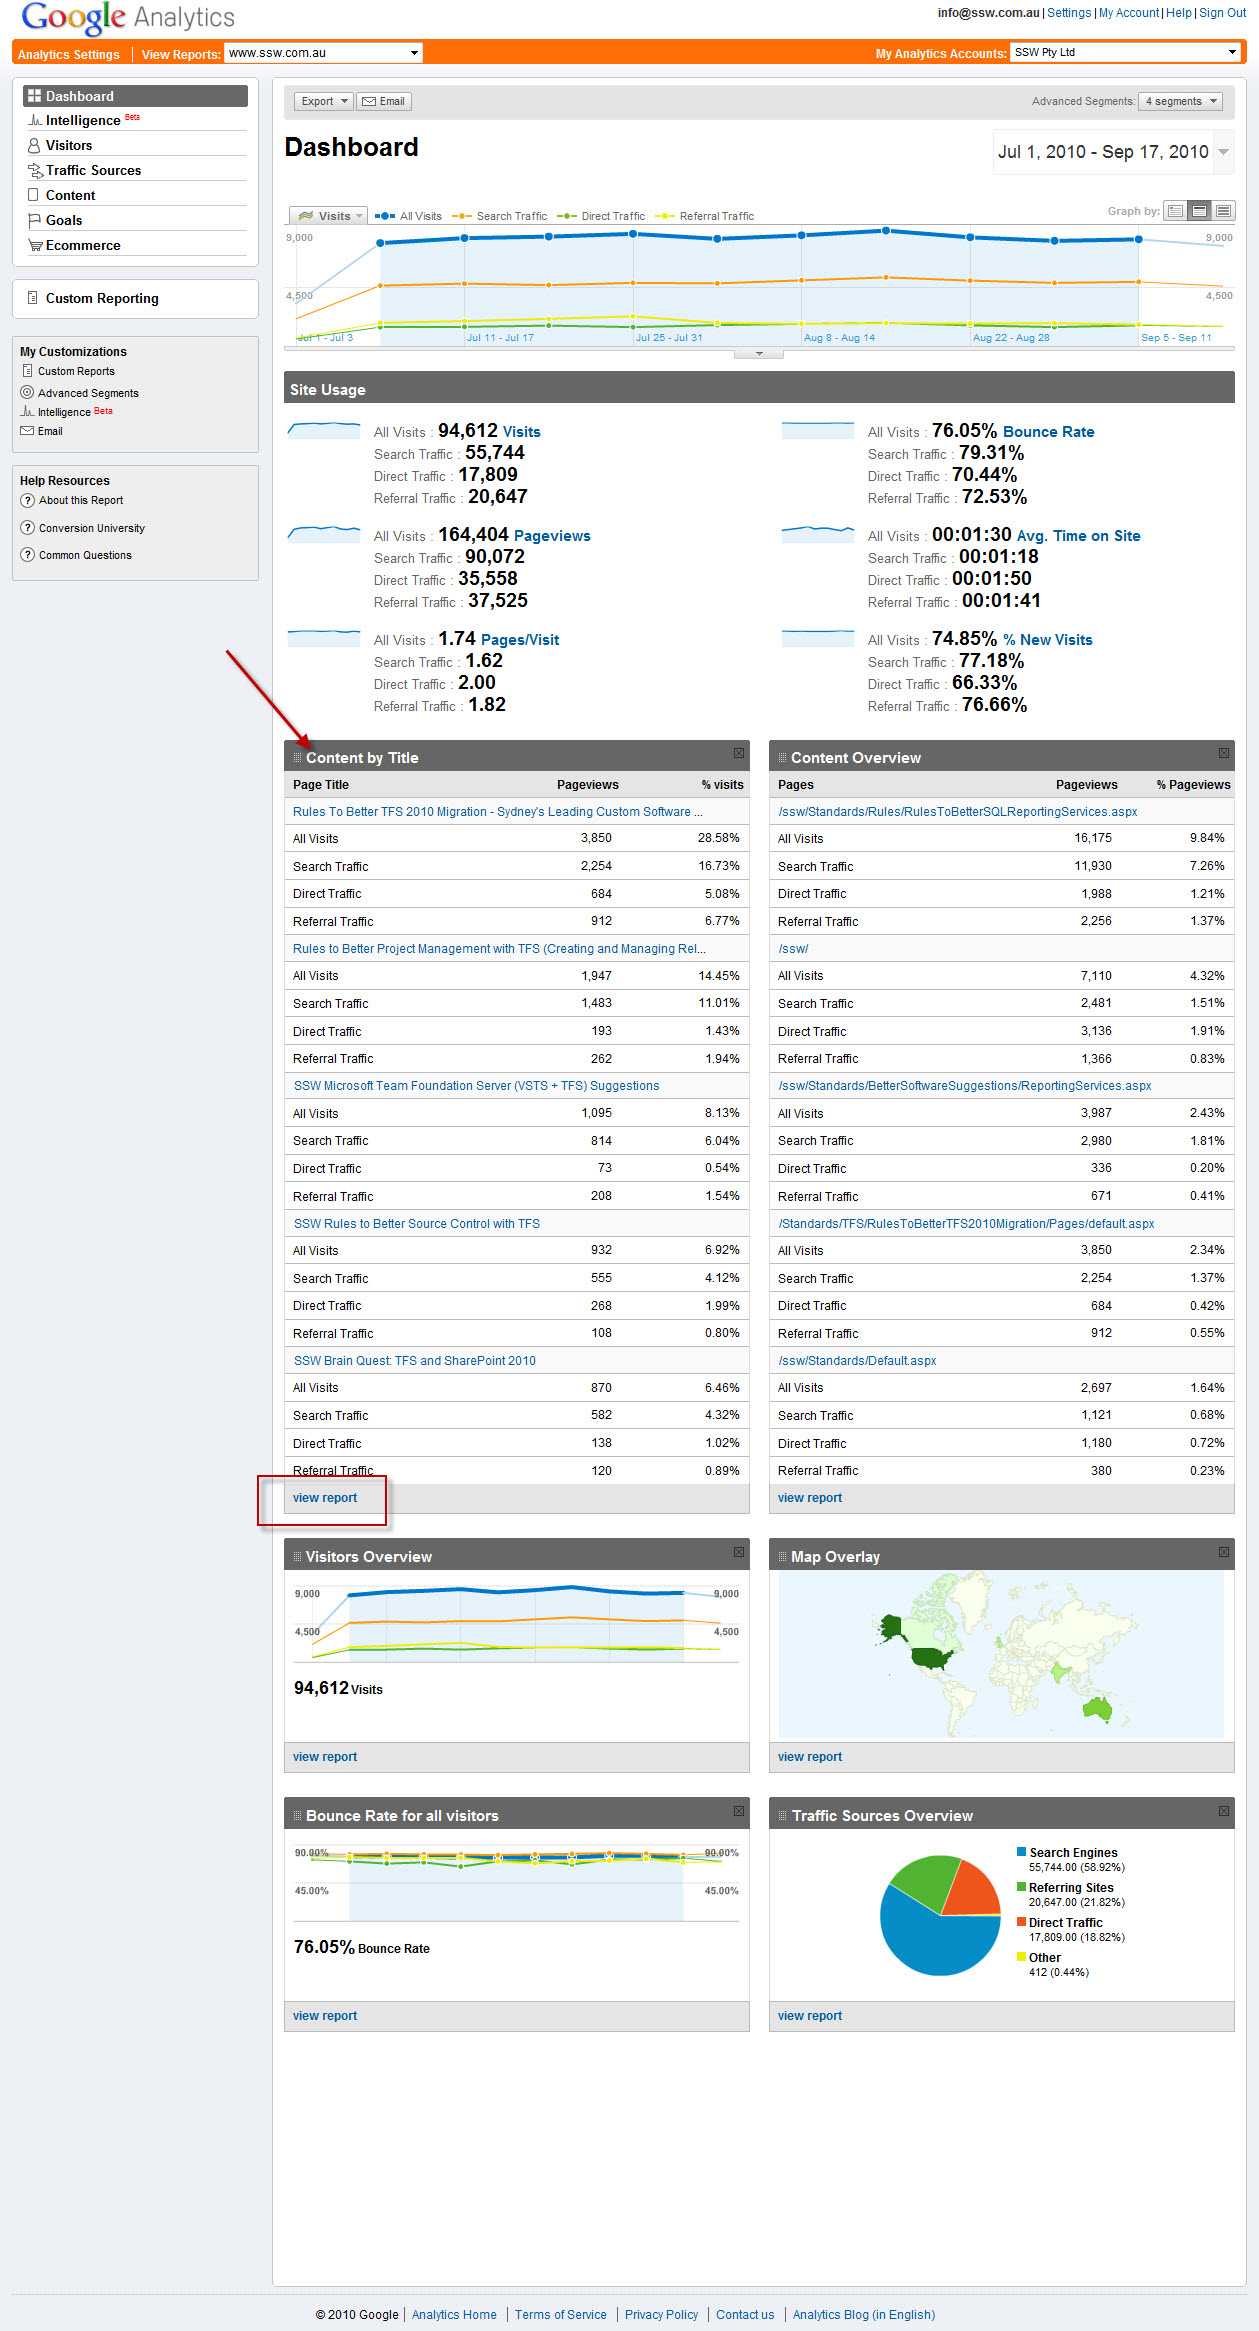
6. Add To Dashboard